The fun part of this title may be a stretch because APIs can be difficult and frustrating to use. Fortunately for you, the examples I will use in these exercises have been thoroughly vetted (by me) to make sure that you get a soft introduction. The acronym API stands for Application Programming Interface. APIs can be used for sharing and receiving data but in this lesson we will focus on receiving; ie. how to get data from someone else’s API and put it to use.
Asteroids
NASA has a vast amount of data that they are willing to share with anyone who is capable of figuring out how to access it. The subset of NASA data we are about to examine involves near-Earth asteroids.
Create an html document and save it as asteroids.html. It’s difficult to load data from an API with plain old javascript so we are going to add in the jquery library. Underneath the <head> tag add the following code:
In case you are interested, the reason that we need jquery is actually because jquery has a function that calls ajax, a technology developed specifically for retrieving and refreshing data.
Once we retrieve our data we will need a place to display it, so add two new div tags to your html:
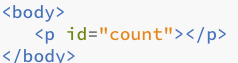
<div id="count"> </div>
<div id="astlist"> </div>
Before we go any further click here to take a look at the data we are about to work with. You should see a lot of text organized in a JSON. We are most interested in the array of json objects titled near_earth_objects, ie. asteroids! JSON feeds can be very individualistic so it’s a good idea to spend some time getting to know a new one before putting it to work. As you can see this one includes an estimated diameter for each asteroid in miles, meters, feet and kilometers. Information is also included about the potential danger of the asteroid to us earthlings, it’s velocity, and lots more. In the next step we will begin the process of extracting this data and putting it to use.
It’s always nice to explore the parameters of a JSON feed so our first task is to figure out how many objects NASA provides us with in this feed. So, add a paragraph tag with an id of “count” to the body of your document.
Now add <script></script> tags just below the closing </html> tag. Then paste the document.ready function below in between the script tags. The purpose of this function is to insure that everything is loaded before actions are executed.
$( document ).ready(function() { })
Now add yet another function called getJson the document.ready function.
$.getJSON('', function(data) { });
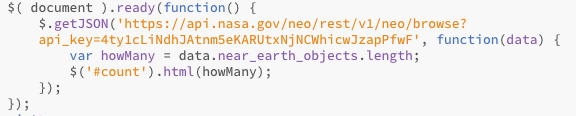
The next step is to add in the api url. This particular feed requires a developer key, which works like a password, letting the server know we are a trusted user. Paste the feed between the parentheses like so…
One caveat about this particular feed. That api key belongs to your instructor. To get your very own key, click here and sign up. Once you have a key, replace my key, which starts after the = sign, with your own.
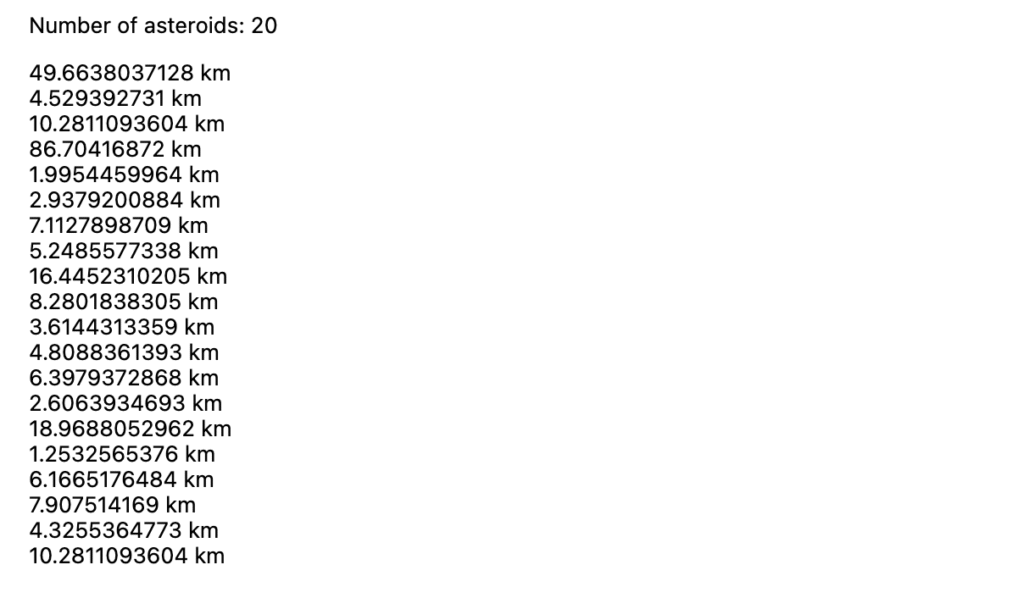
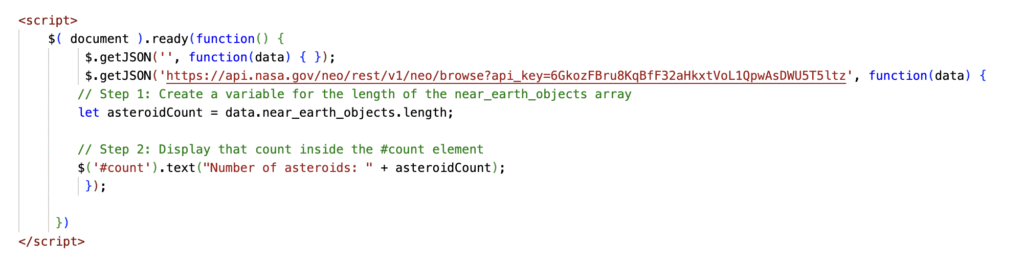
Take a deep breath. We are almost ready to count asteroids. Use the screen capture below as your guide to (1) create a variable tied the length of those dreaded near earth objects, and (2) make the variable display within the p tags with the id of ‘#count’.
Now test your document. Did the number 20 appear by any chance? Welcome to the exciting world of json data extraction. 20 is the number of data objects this feed offers by default.
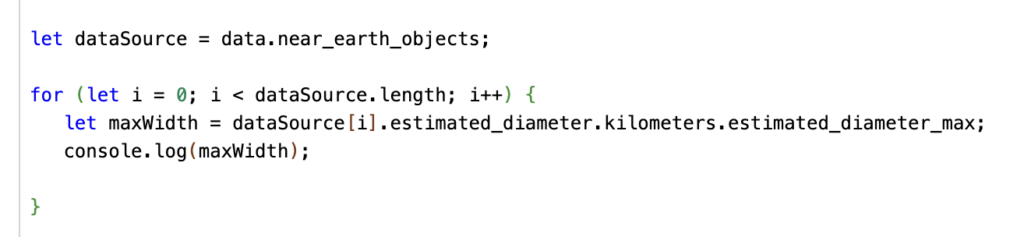
Our next step is to create a variable that is tied to all 20 of those objects. To do so, add this line of code: let dataSource = data.near_earth_objects;
Now add in the for loop shown below. a: In case it’s not clear what we are doing with this for loop, here is the rundown: We created a standard for loop which is designed to loop through each of the 20 objects inside of the dataSource variable which, remember, represents the near_earth_objects array. b: We created the maxWidth variable to sequentially extract the maximum estimated diameter in kilometers of each of the 20 asteroids. c: We logged those values to the console. Test the page and take a look at your console to see if it works.
Console logging is useful, but it is much more satisfying when results appear on the page. To achieve that satisfaction, add a div tag to your html <div id=”showData”></div> , and replace console.log (maxWidth) with $(‘#showData’).append(maxWidth + ” km<br>”);. Fix all of the wonky quotation marks. Now you should see a nice line of 20 data points indicating the width of each object in kilometers. But is that really satisfying? Does it even come close to displaying the reality of all of those asteroids whizzing around out there in space? NO! We’re humans and we need more. In the next few steps we will explore ways to turn those numbers into (slightly more) inspiring round blobs, with a diameter tied to their actual width.
Select the body. We are going to inject those blobs directly into the body of our document and use plain javascript to do so. So, first step: Create a variable named asteroidDisplay just below the <script> tag.
let asteroidDisplay = document.body;
Comment out $(‘#showData’).append(maxWidth+”<br>”); and replace it with this line of code:
Comment out $(‘#count’).text(“Number of asteroids: ” + asteroidCount); as well. We don’t need to look at those numbers anymore.
Before you test this thing out, one more step is needed. The code you just pasted in creates 20 div tags that are tied to the width of those asteroids. Problem is, you won’t be able to see them without a background color other than white. Add <style></style> tags just above the <title></title> tags, and set the background color of all div tags to black div {background-color: #000; }.
NOW, test your creation. Do you see 20 tiny dots? If so, let’s make them bigger by changing the value of maxWidth as shown below.
let maxWidth = dataSource[i].estimated_diameter.kilometers.estimated_diameter_max * 10;
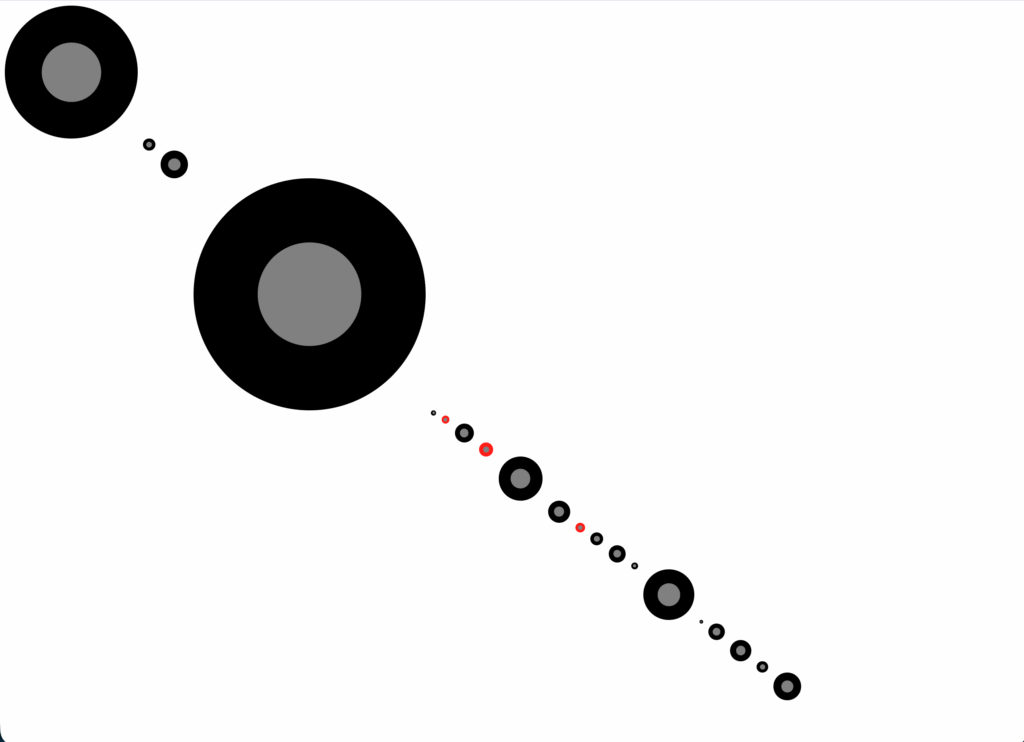
But why not circles? Add border-radius: 50%; to your div properties to get rid of those corners. While you are at it, try float: left; and margin: 10px; Now how do things look?
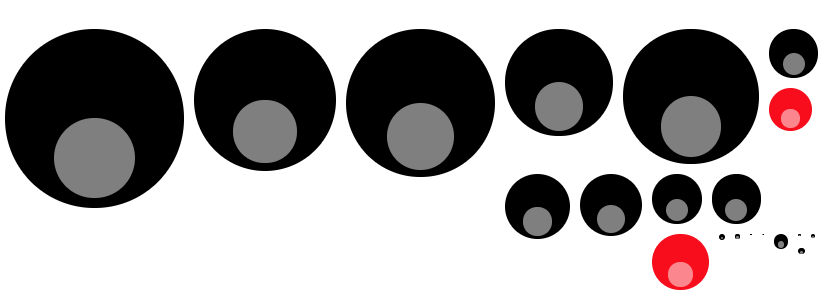
Time for a challenge. You are using the kilometers.estimated_diameter_max value from the api but, apparently, nobody knows exactly how wide these things really are. To give an idea of the potential range in sizes we also need the kilometers.estimated_diameter_min value to be in play. Plus there is a very interesting boolean (yes no) value for each object, that indicates whether or not it poses a potential risk for us frail humans. The screen capture below shows a page that I created that depicts all three sets of data. The black circles show max diameter, while the internal gray circles show the minimum value. The red circles indicate the dangerous asteroids. Your job is to create something similar.
Hint #1
Add two new variables – minWidth and isDangerous.
let minWidth = dataSource[i].estimated_diameter.kilometers.estimated_diameter_min *10;
let isDangerous = dataSource[i].is_potentially_hazardous_asteroid;
Hint #2
Set the outer color: red if dangerous, black if not.


 . Fix all of the wonky quotation marks. Now you should see a nice line of 20 data points indicating the width of each object in kilometers.