
Turning numbers into stories. Capturing the Journey.
Abstract
Data is that kid in your class or work place that everyone leans on to get the work done, but never truly appreciates. It is the superstar defender on the soccer team who never gets as much praise as the goalie for the championship victory. It is the world’s most intricate puzzle that everyone complains about for its complication, yet admires for its mesmerizing final picture.
Our world runs on numbers. Everything we do, watch, play, and say is in some way connected to data. Even still, not everyone truly grasps the power and influence numbers have on our lives. Granted, it is understandably not everyone’s cup of tea to collect, compile, work, and analyze immense amounts of information. This indifference to data work; however, should not lead to an indifference towards data all together, and Big UGA is here to prove that.
WHO, WHAT, WHY:
Each year The University of Georgia collects massive amounts of information about various aspects of its community. There are data reports on everything from incoming student demographics to classroom usage time. Yet, despite the incredible amount of information that is collected, there is no “one stop shop” to view the reports and trends. Without a resource such as this, a gaping hole between the public and stories that numbers can tell forms.
Big UGA is here to bridge that gap.
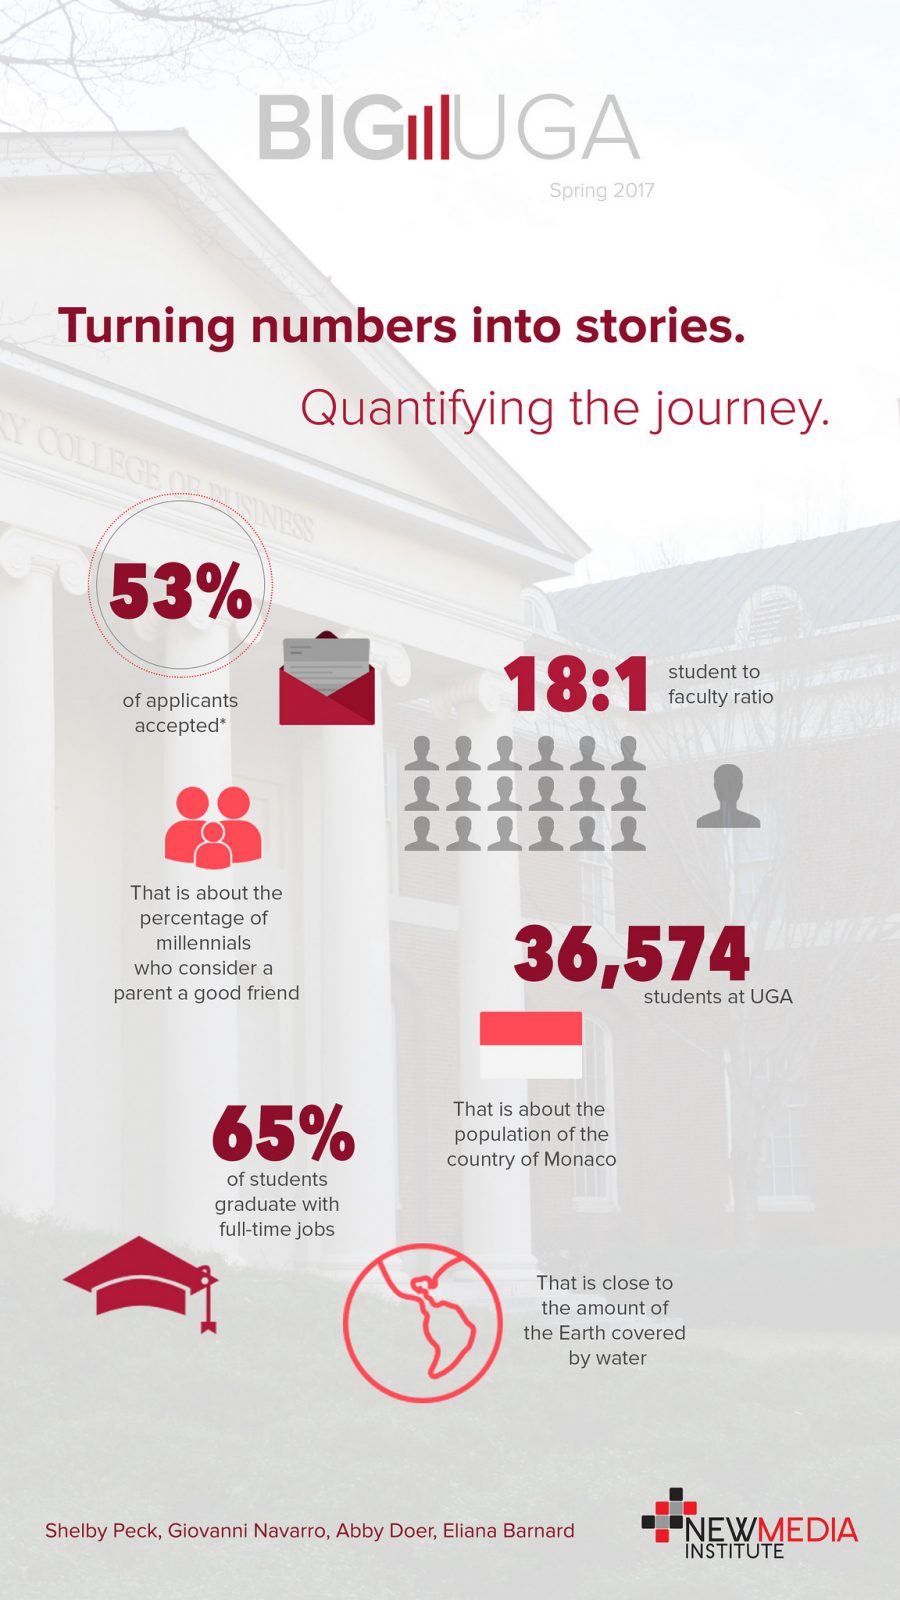
Big UGA is founded on the belief that numbers are vibrant with life. It is an interactive web based experience that gives users the ability to peek into the past, present, and future of the University of Georgia community. It gives digits faces, intertwines stories with rates and percentages, and most importantly of all it demonstrates the potential data has to help us truly see the community around us.
Big UGA encapsulates the journey of the typical bulldawg through molding data into interactive graphics, personal stories, and videos. The platform provides the user with the opportunity to place his or herself in the shoe of one of the “numbers” that make up UGA’s student body. More specifically, the journey guides users through the three major phases of life at The University of Georgia: acceptance, enrollment, and graduation.
ACCEPTANCE:
It gives the massive 37,000 student enrollment number a little more color by connecting it to unique stories. It uses interactive maps and charts to dive into the demographics of freshmen classes by revealing information such as which states students called home before moving to Athens.
ENROLLMENT:
It illustrates the unique experience each student can have while enrolled at UGA by displaying facts about campus involvement and trends in student credit load. This allows for prospective students, current students, and any other Internet users to take a peek into what life is like as a dawg.
GRADUATION:
It shines a light on the UGA legacy by highlighting post graduation adventures through sharing where students go and what challenges they tackle next. It includes unique infographics that display interesting facts reflecting where dawgs work after college and who employs them.
OUR PROGRESS:
As Big UGA has progressed through the stages of becoming a helpful and enjoyable resource for all web users, both development and design have been crucial. Software system, Tableau, has pushed Big UGA to not only provide practical data visualizations but to also generate source of aesthetic pleasure. One of the biggest goals of Big UGA is to showcase just how telling, interesting, and enjoyable unlocking the potential of data can be. Big UGA brings data down to Earth, making it easy to understand and fascinating to explore.
BIG PICTURE:
Overall, the goal of Big UGA is to reflect the captivating capabilities the data at The University of Georgia possesses, and to make data storytelling come alive. Big UGA is one small piece to a larger puzzle, it is one small step toward a more data enthusiastic world.