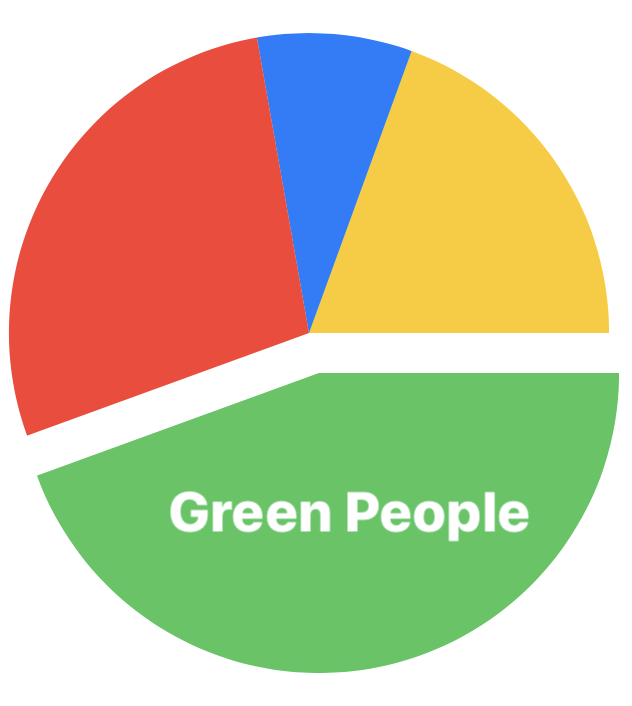
Mastering SwiftUI led you through a long lesson on creating a pie chart with arcs enveloped by a ZStack. The code to make the whole pie is provided below, and your job is to offset one slice of the pie (an arc of course) and overlay it with a label of your choice.
Starter Steps
- Create a new SwiftUI view in the same Xcode project that you created for the previous arc slider exercise. Name it pie.swift
- Replace Text(“Hello, World!”) with the ZStack and and arc paths below. When you preview, you should see a pie chart!
- Use offsets, overlays, and text formatting to make your pie chart look as much as possible like this one.

Pie Chart Code
(Note: control+i will reformat your code)
ZStack {

    Path {
        path in
        path.move(to: CGPoint(x: 200, y: 200))
        path.addArc(center: .init(x: 200, y: 200), radius: 150, startAngle: Angle(degrees: 0.0), endAngle: Angle(degrees: 290), clockwise: true)
    }
    .fill(Color.yellow)

    Path {
        path in
        path.move(to: CGPoint(x: 200, y: 200))
        path.addArc(center: .init(x: 200, y: 200), radius: 150, startAngle: Angle(degrees: 290.0), endAngle: Angle(degrees: 260), clockwise: true)
    }
    .fill(Color.blue)
    Path {
        path in
        path.move(to: CGPoint(x: 200, y: 200))
        path.addArc(center: .init(x: 200, y: 200), radius: 150, startAngle: Angle(degrees: 260.0), endAngle: Angle(degrees: 160), clockwise: true)
    }
    .fill(Color.red)

    Path {
        path in
        path.move(to: CGPoint(x: 200, y: 200))
        path.addArc(center: .init(x: 200, y: 200), radius: 150, startAngle: Angle(degrees: 160.0), endAngle: Angle(degrees: 00), clockwise: true)
    }
    .fill(Color.green)

}